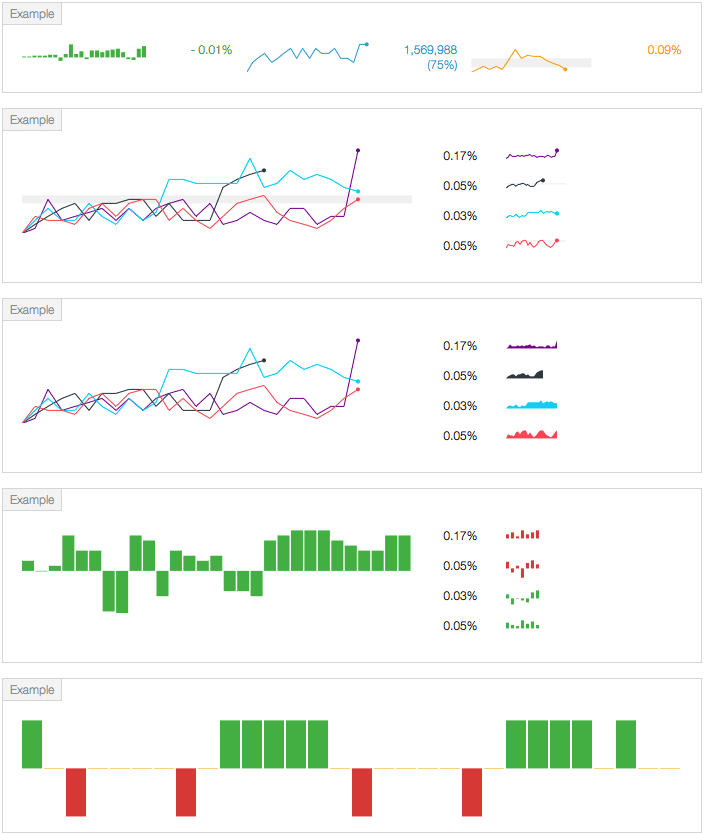
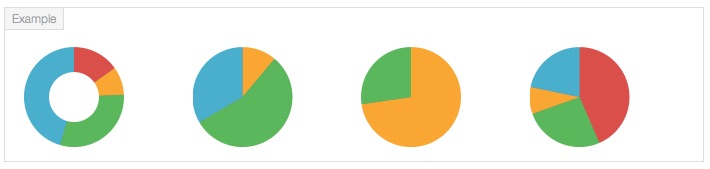
Sparky & Slicey
Sparkline and Pie chart components.
At Adslot we need to draw a lot of line and column graphs per page. This called for a performant solution, preferably without adding to the page load weight. After researching available graphing solutions I realised that we could use AngularJS (which was already loaded) to replace a lot of the manipulation that these large graphing libraries provided. Making our own graphing library also gave us full control over the look and interaction of the graph elements .
I made a prototype of a simple line graph and performance tested 150 on a page with constantly randomizing data. It stood up over all browsers, even IE9 (our lowest target). This directive is open source.
It made its debut at Adslot in the Q1 2014-15 launch of the new Campaign Management workflow across Adslot Media, Publisher and Partner.
In May 2015 I created a React version of Slicey in a weekend. I did this to learn React using a real–world component.
Go to github.com